
Welcome to RPAG Quarterly Market Review for Q3 2022 where we discuss U.S. equity markets, international equities, broad U.S fixed income market, and much more.
Presenter:
- Geoff Keeling, Director, Investment Research
U.S. equity markets had a volatile third quarter, rising sharply in July, before giving back all those gains and then some, to end the quarter down 4.5% (Russell 3000). International equities fell as well, dropping 9.9% during the third quarter (MSCI ACWI ex U.S.). The broad U.S. fixed income market continued its sell-off, down 4.8% for the quarter (Bloomberg Barclays Aggregate) on rising interest rates. Driving most of this volatility was central banks across the world raising interest rates to fight inflation. The Federal Reserve raised interest rates 150 basis points during the third quarter with further hikes expected. Allowing the Fed to raise interest rates was the tight U.S. labor market, with unemployment at 3.5% in September. Unlike the first half of the year, growth stocks, both domestically and internationally, held up slightly better during the third quarter. (All data from MPI)
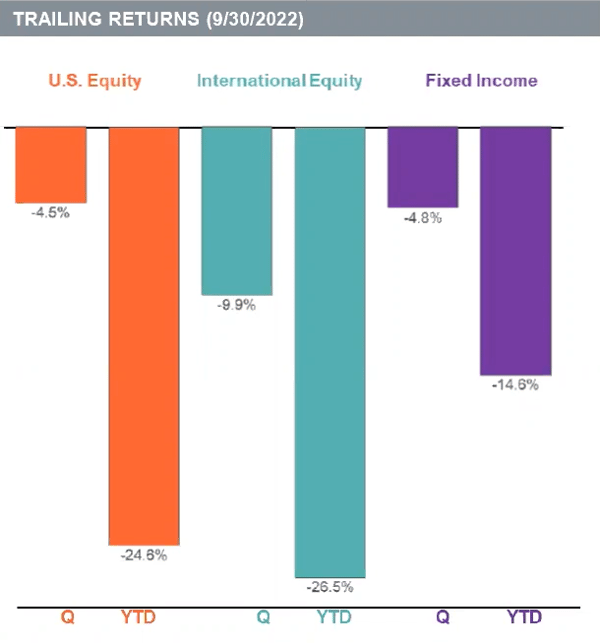
Quarterly and year-to-date returns of the following indices: U.S. Equity (Russell 3000 Index), Fixed Income (Bloomberg Barclays U.S. Aggregate Bond Index) and International Equity (MSCI ACWI ex U.S. Index)
U.S Equity- The broad U.S. equity market, as measured by the Russell 3000 Index, was down 4.5% for the quarter
- The best performing U.S. equity index for the quarter was Russell 2000 Growth, returning a positive 0.2%
- The worst performing U.S. equity index for the quarter was Russell 1000 Value, returning a negative 5.6%
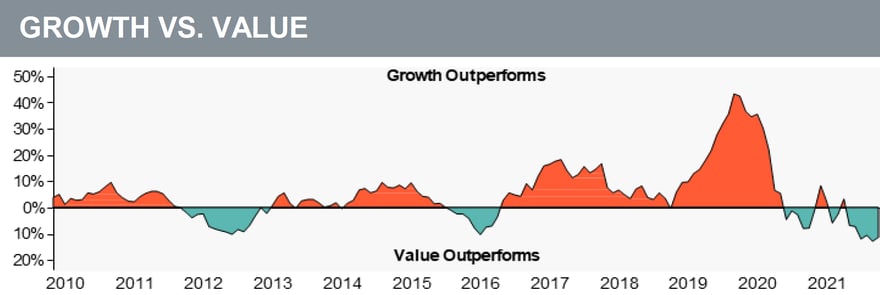
Over the last year, value stocks outperformed growth stocks by 11.2%. For the trailing quarter, growth stocks outperformed value stocks by 2.0%.The graph below is plotted using a rolling one year time period. Growth stock performance is represented by the Russell 1000 Growth Index. Value stock performance is represented by the Russell 1000 Value Index.
- Developed international equity returned a negative 9.3% in the last quarter (MSCI EAFE).
- Emerging market equity posted a negative 11.6% return (MSCI Emerging Markets Index).
Over the last year, developed international stocks outperformed emerging market stocks by 3.4%. For the trailing quarter, developed international stocks outperformed emerging market stocks by 2.3%. The graph below is plotted using a rolling one year time period. Developed international stock performance is represented by the MSCI EAFE Index. Emerging market stock performance is represented by the MSCI Emerging Markets Index.
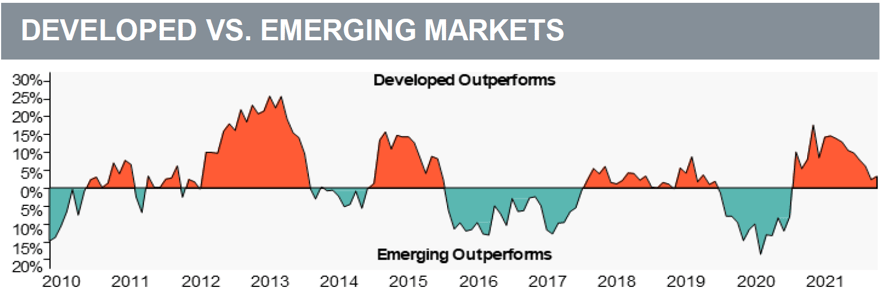
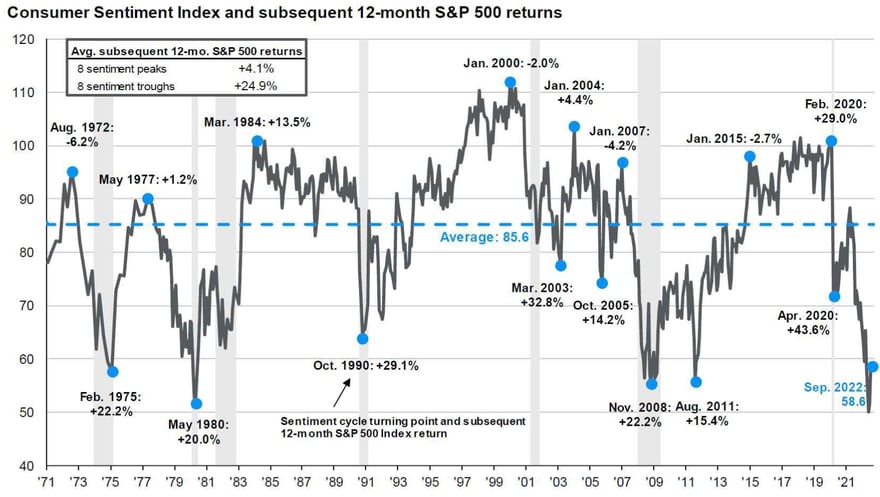
Chart of the Quarter
While 2022 has been tough for investors, and many think the outlook is bleak, historically periods of low consumer confidence have been some of the best times to be invested. Of the last 8 troughs in consumer sentiment, the return of the S&P 500 over the following 12 months averaged 24.9%. While it's normal to be concerned when equity markets enter bear territory, market volatility is to be expected and it is important to stay invested and take advantage of the opportunities that periods of volatility provide.
Download a copy of this market review document by clicking here, or contact us at the email address below.
________________________________________
Looking for more information?
Contact the RPAG Support Team, support@rpag.com, to learn more about RPAG and get help with our Platform, or anything else!